Examples:
Traditional econometrics
The use of statistical analysis and econometric techniques to find causality
I am a graduate student at the University of California, San Diego studying economics and econometrics. However my interests have shifted towards data mining and predictive analytics. This site is devoted to others who are making the transition from traditional statistical analysis to find causality to using languages such as Python and R, NoSQL databases such as MongoDB, and interactive visualizations such as D3 to tease out the relationships in unstructured data.
The use of statistical analysis and econometric techniques to find causality
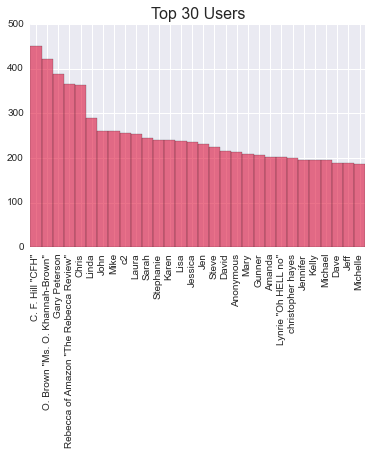
import seaborn
import numpy as np
from collections import Counter
import matplotlib.pyplot as plt


users=Counter(b['review/profileName'] for b in data)
values = [count for item, count in users.most_common()[:30]]
labels = [item for item, count in users.most_common()[:30]]
labels = [removeNonAscii(b) for b in labels]

indexes = np.arange(len(labels))
width = 1


plt.bar(indexes, values, width, color='crimson', alpha=0.6)
plt.xticks(indexes + width * 0.5, labels, rotation=90)
plt.title("Top 30 Users",fontsize=16)
data citation: Image-based recommendations on styles and substitutes J. McAuley, C. Targett, J. Shi, A. van den Hengel SIGIR, 2015
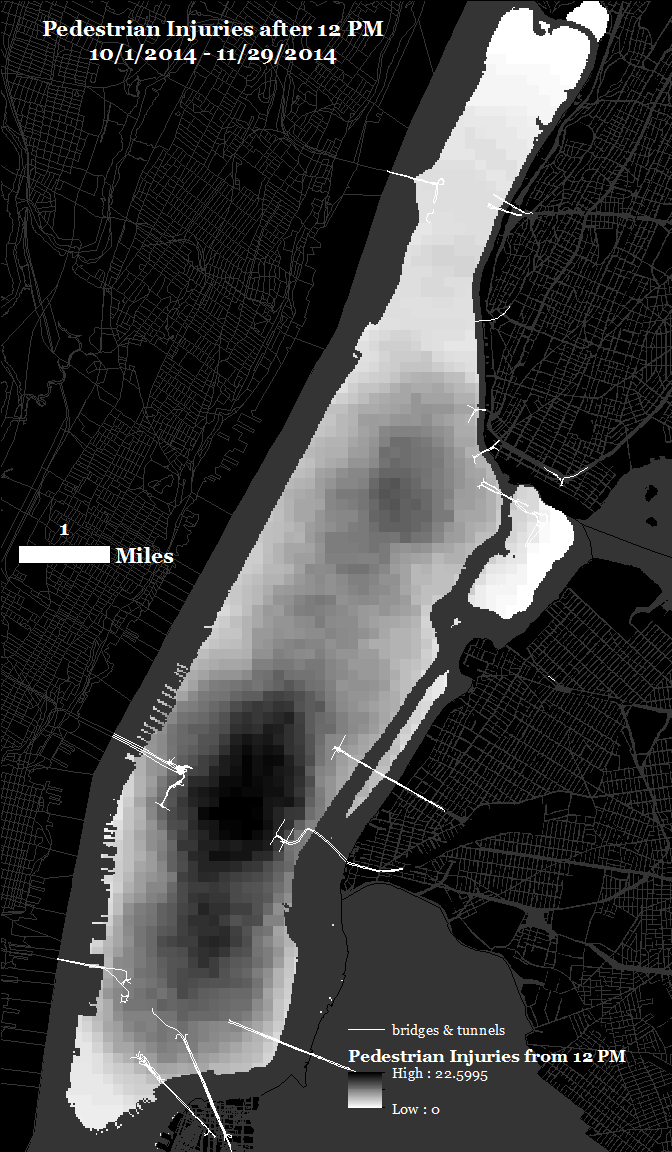
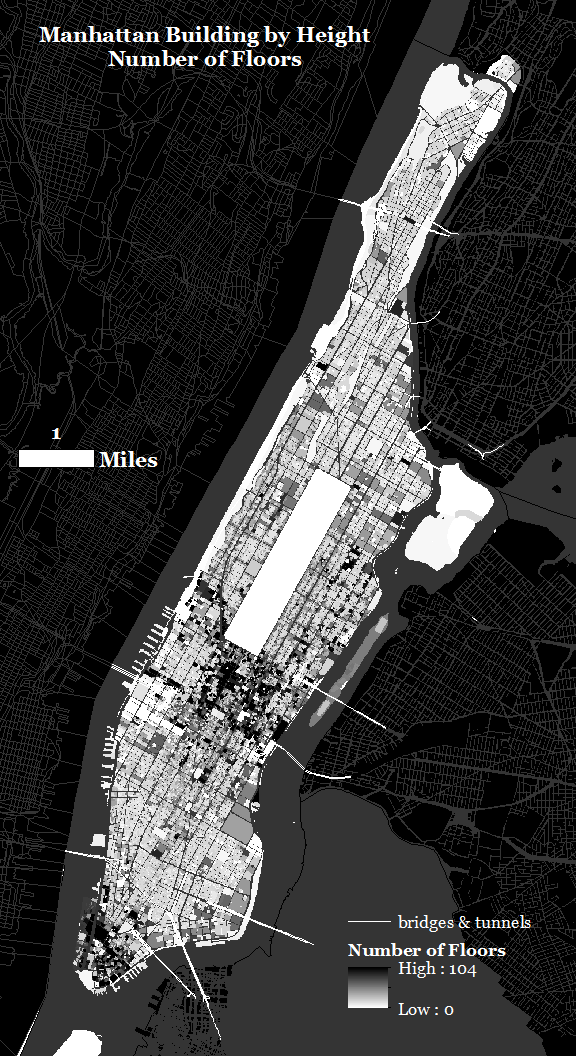
Example: Geospatial Analysis
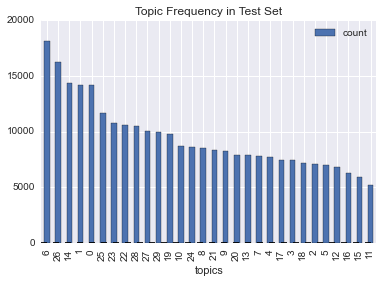
Example: Latent Dirichlet Allocation
The use of APIs and scraping -- Python
from lxml import html
import requests
page = requests.get('http://infoproc.blogspot.jp')
tree = html.fromstring(page.text)
categories = tree.xpath('//a[@dir="ltr"]/text()')
categories=list(categories)

['physics',
 'finance',
 'globalization',
 'genetics',
 'brainpower',
 'photos',
 'technology',
 'economics',
 'science',
 'american society',
 'China',
 'psychometrics',
 'credit crisis',
 'travel',
 'innovation',
 'higher education',
 'human capital',
Example: The New York Times API
bucket='http://api.nytimes.com/svc/community/v3/user-content/recent.json?
api-key=###&url=http://www.nytimes.com/2015/04/12/opinion/sunday/david-brooks-the-moral-bucket-list.html'

response = urllib.urlopen(bucket).read()
response_dictionary = json.loads(response)

def parse(mail):

    brooks = []
    for b in mail:
        dic = {}
        dic['comment'] = b['commentBody']
        dic['date'] = b['createDate']
        dic['comment_type'] = b['commentType']
        dic['editorsSelection'] =b['editorsSelection']
        dic['email'] = b['email']
        dic['recommend'] = b['recommendationCount']
        dic['replies'] = b['replies']
        dic['name'] = b['userDisplayName']
        dic['location'] = b['userLocation']
        dic['login'] = b['login']

        brooks.append(dic)
    return brooks`

comments=response_dictionary['results']['comments']
comments=parse(comments)
comments[0]

{'comment': u'The lament of the hollow man who sees but does not understand.',
 'comment_type': u'comment',
 'date': u'1428853503',
 'editorsSelection': 0,
 'email': u'wilkinson.eileen@gmail.com',
 'location': u'Maine',
 'login': None,
 'name': u'Eileen Wilkinson',
 'recommend': 4,
 'replies': []}